
How to Build a Custom IoT Dashboard
Table of Contents
Launch your IoT product in a few weeks for MVP
Learn more
1. Understanding IoT Dashboard Requirements
A successful custom IoT dashboard starts with clear requirements. Before you build IoT dashboard features, define the business goal: are you monitoring industrial equipment, smart buildings, fleet devices, environmental sensors, or consumer products? The use case determines every design choice, from data frequency to visualization style.
Start by identifying the core users and the decisions they need to make. Operators may need a fast view of anomalies, managers may want KPIs and trends, while engineers often need raw telemetry and device logs. A useful dashboard should reduce cognitive load, not add to it.
Key questions to answer early:
- What devices are connected?
- What metrics matter most?
- How often does data arrive?
- Which alerts are critical?
- Who needs access, and at what permission level?
- Is the dashboard for desktops, tablets, or mobile devices?
It also helps to define success metrics for the project. For example, if you are building a dashboard for predictive maintenance, you might measure reduced downtime, faster incident response, or improved equipment uptime. In IoT dashboard development, these requirements shape the architecture and data model.
A practical way to organize requirements is with a simple matrix:
| Area | Example Questions | Output |
|---|---|---|
| Business goal | What problem are we solving? | Project objective |
| Users | Who will use the dashboard? | User roles |
| Data | What signals are available? | Sensor list |
| Performance | How real-time must it be? | Latency target |
| Security | Who can view or control devices? | Access policy |
At this stage, it is worth mapping the minimum viable dashboard first. You can always add advanced analytics later. A well-scoped plan makes the rest of the build easier and keeps the project aligned with the real operational needs.
For planning and design inspiration, you can also review our guide on IoT application architecture and compare your requirements with common telemetry workflows.
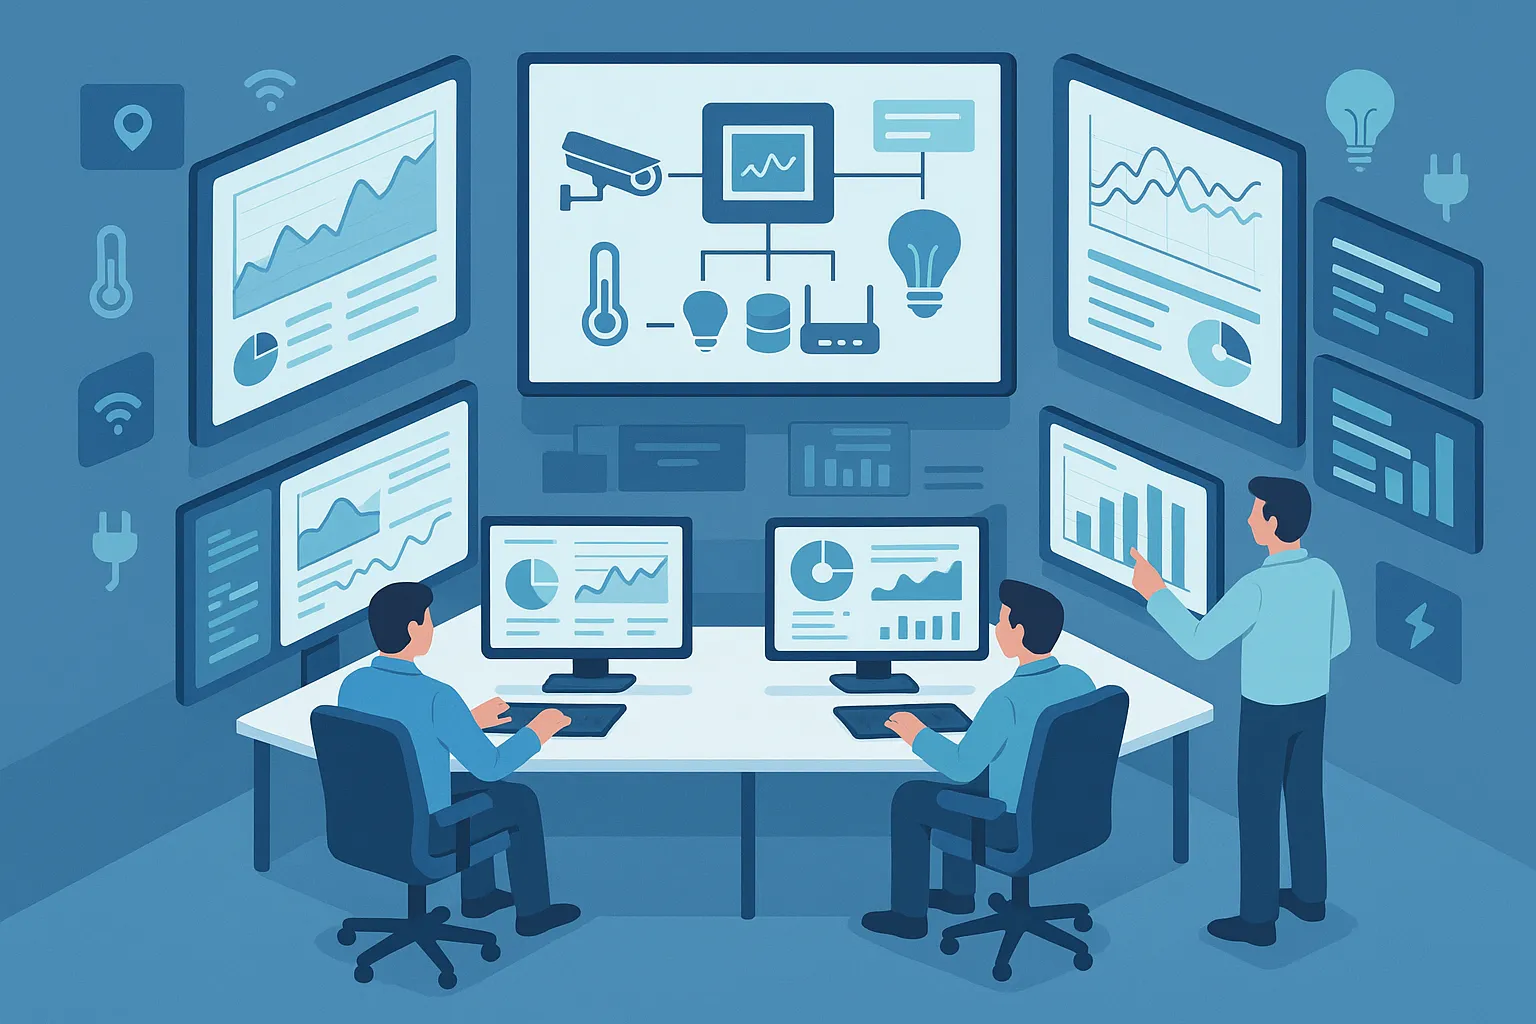
Image prompt: A modern IoT control room illustration showing engineers analyzing dashboards on multiple screens with sensor icons, charts, connected devices, and a clear flow from devices to analytics; clean UI, blue and teal palette, professional SaaS-style design, high detail, isometric perspective.
2. Choosing the Right Technology Stack
Once the requirements are defined, the next step in iot dashboard development is selecting a technology stack that supports your performance, scale, and integration needs. The best stack depends on whether you need a lightweight internal tool, a customer-facing analytics platform, or a mission-critical operations console.
A typical stack includes four layers:
- Device communication layer: MQTT, HTTP, WebSockets, CoAP
- Backend/API layer: Node.js, Python, Go, Java, .NET
- Data storage layer: PostgreSQL, TimescaleDB, InfluxDB, MongoDB, Redis
- Frontend layer: React, Vue, Angular, Svelte, D3.js, Chart.js
For many projects, MQTT is a strong choice for device messaging because it is lightweight and built for unreliable networks. If your project requires mqtt dashboard design, ensure your stack can handle topic hierarchies, retained messages, QoS settings, and subscription patterns cleanly.
Here are some common technology decisions:
- Frontend: React is often chosen for reusable UI components and a large ecosystem.
- Backend: Node.js works well for event-driven data streams, while Python is useful for analytics and ML.
- Time-series storage: TimescaleDB or InfluxDB is ideal when the dashboard focuses on telemetry and trends.
- Streaming: Kafka or RabbitMQ can help if you expect high volume or multiple consumers.
If you want a faster start, choose familiar tools with strong community support. If the dashboard must scale across many tenants or devices, prioritize systems that support horizontal scaling and observability.
When comparing options, think beyond feature lists. Consider deployment complexity, maintenance burden, developer skill availability, and the long-term cost of ownership. A simpler stack that your team can maintain is usually better than an overengineered one.
For a deeper comparison of frontend options, see our article on best frameworks for real-time web apps.
3. Designing the Dashboard Architecture
A strong architecture is the foundation of a reliable custom IoT dashboard. The goal is to create a structure that can ingest device data, process events, store history, and render insights without slowing down.
A typical architecture includes these components:
- Devices and sensors sending telemetry
- Message broker receiving events, often MQTT
- Processing service validating and transforming data
- Database storing current and historical readings
- API layer exposing data to the frontend
- Dashboard UI rendering charts, tables, and alerts
A common pattern is to separate real-time state from historical analytics. The dashboard should show the latest values instantly, while long-term trend analysis queries a time-series store. This separation improves performance and makes scaling easier.
A useful architecture decision is whether to use a monolith or microservices. For smaller teams and early-stage products, a modular monolith is often easier to ship and maintain. For large-scale deployments, microservices can isolate ingestion, analytics, authentication, and notification logic.
You should also plan for:
- Multi-device support: handle thousands of device IDs
- Tenant isolation: separate data by customer or site
- Fallback behavior: show cached values when streams lag
- Observability: logs, metrics, and traces for debugging
A clean architecture also supports future features like anomaly detection, role-based views, or predictive maintenance scoring. Think in layers, not just screens.
For implementation guidance, our post on event-driven system design explains how streaming components fit together in modern IoT platforms.
4. Setting Up Data Ingestion and Processing
Data ingestion is the heartbeat of build iot dashboard projects. If data arrives late, incomplete, or inconsistent, even the best interface will fail to deliver value. The key is to design a pipeline that reliably receives device messages, normalizes them, and prepares them for visualization.
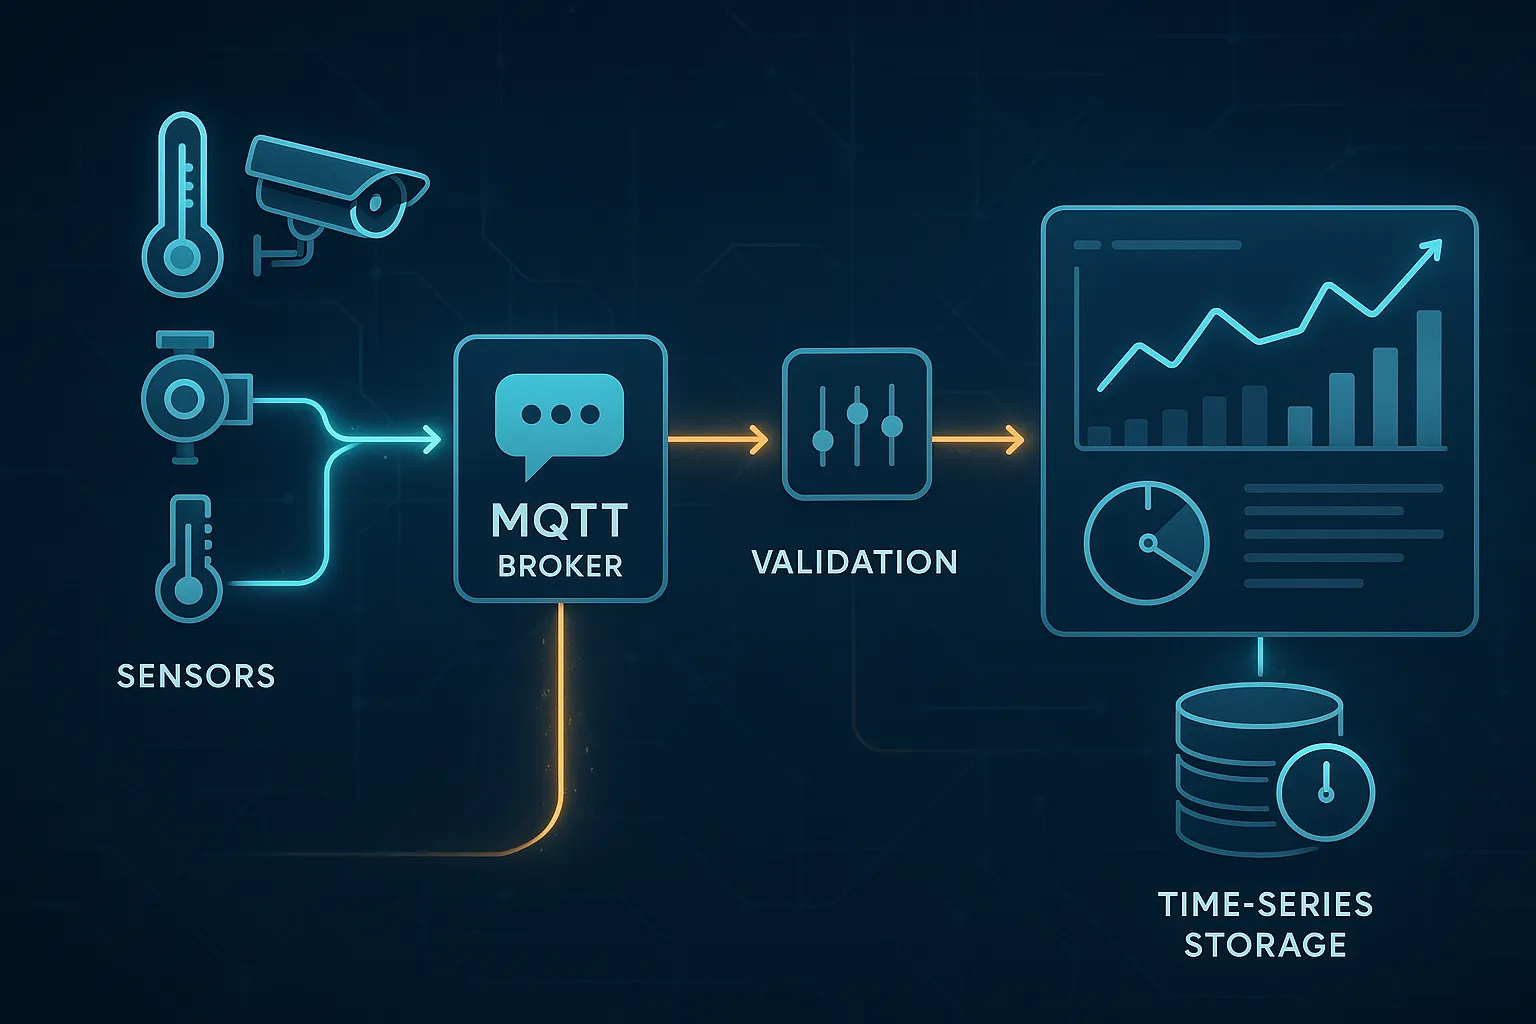
Most IoT platforms use a message broker such as MQTT. Devices publish telemetry to topics, and backend services subscribe to the relevant streams. From there, a processing layer can validate payloads, enrich data with metadata, and write to storage.
A good ingestion pipeline usually includes:
- Device message publishing
- Broker subscription and routing
- Schema validation
- Unit conversion and normalization
- Aggregation and filtering
- Storage and index updates
Important design considerations:
- Use a consistent payload schema with timestamp, device ID, metric name, and value.
- Reject malformed messages early to prevent bad data from spreading.
- Apply throttling or batching when devices send high-frequency updates.
- Support both current-state updates and historical event logs.
For example, a temperature sensor may publish raw Celsius values, but the dashboard might need converted units, a site label, and threshold metadata. In that case, the processing service should enrich the event before it reaches the UI.
| Step | Purpose | Example |
|---|---|---|
| Receive | Collect device messages | MQTT topic subscription |
| Validate | Ensure schema correctness | JSON schema check |
| Transform | Normalize values | Convert units |
| Enrich | Add context | Site, device type |
| Store | Save for history | Time-series DB |
When designing the pipeline, prioritize reliability over complexity. A simpler, observable ingestion path is easier to debug and scale. You can later add stream processing, windowed aggregation, or anomaly detection once the baseline is stable.
If your system relies heavily on MQTT, our internal guide to MQTT topic best practices is a helpful companion.
Image prompt: A detailed illustration of an IoT data pipeline with sensors publishing MQTT messages into a broker, then flowing through validation, transformation, and time-series storage before appearing on a dashboard; glowing data streams, schematic network lines, clean enterprise style, high detail, modern technical infographic.
5. Implementing Real-Time Data Visualization
One of the main reasons teams build iot dashboard interfaces is to see live data without delay. This is where real time iot data visualization becomes essential. Users need to understand what is happening now, not just what happened five minutes ago.
Real-time visualization is not only about speed; it is also about clarity. The UI should update smoothly and highlight the most important changes. A dashboard that refreshes too aggressively can become noisy and hard to read.
Popular visualization types for IoT dashboards include:
- Line charts for sensor trends over time
- Gauges for current operating ranges
- Status cards for online/offline conditions
- Heatmaps for spatial patterns
- Tables for device inventories and event logs
- Notifications panels for anomalies and alerts
Use live updates carefully. WebSockets or server-sent events can push updates efficiently, while polling may be acceptable for lower-frequency systems. For high-frequency telemetry, consider rendering only changed components rather than redrawing the entire page.
The most effective dashboards often separate “live” and “historical” views. For instance, a live panel can show the latest 10 readings, while a trend chart summarizes the last hour or day. This helps users spot anomalies quickly without losing context.
Best practices for real-time visualization:
- Limit each chart to the metrics that matter most.
- Use color consistently for warnings, critical events, and healthy states.
- Avoid clutter by grouping related devices or sensors.
- Add timestamps so users know how fresh the data is.
- Offer drill-down views for more detail.
A good rule: if a metric changes too fast to read, aggregate it into meaningful intervals. Real-time does not mean every raw event must be shown individually.
For UI examples, see our internal resource on live telemetry UX patterns.
6. Developing User Interface Components
The frontend is where your custom IoT dashboard becomes usable. Great UI design turns complex telemetry into a clear and actionable experience. In practice, that means building reusable components that can display sensor data, device status, charts, filters, and alerts consistently.
A modern IoT dashboard UI usually includes:
- A navigation sidebar for sites, devices, or asset groups
- KPI cards for quick status checks
- Chart widgets for time-series data
- Tables for device inventory and event history
- Filters for date ranges, tags, and device types
- Detail drawers or modals for drill-down analysis
When building components, design for reusability. For example, a metric card should support multiple data types: temperature, humidity, pressure, battery level, or machine state. A chart component should accept different series and update live without rebuilding the entire page.
Accessibility matters too. Use strong contrast, readable font sizes, keyboard navigation, and non-color indicators for warnings. In industrial or field environments, users may rely on tablets or low-light displays, so the interface should remain usable across conditions.
Good UI systems also account for loading and error states. If a device is offline, the dashboard should show that clearly instead of leaving users guessing. If data is delayed, surface the delay rather than silently showing stale values.
Consider these interface principles:
- Keep the primary action visible.
- Put the most important metrics above the fold.
- Use consistent spacing and hierarchy.
- Make drill-down paths obvious.
- Avoid showing too many metrics on one screen.
This is also where product branding and user trust come together. A clean, stable interface gives users confidence that the data is accurate and the system is reliable.
For frontend implementation patterns, our guide to component-driven dashboard design offers practical examples.
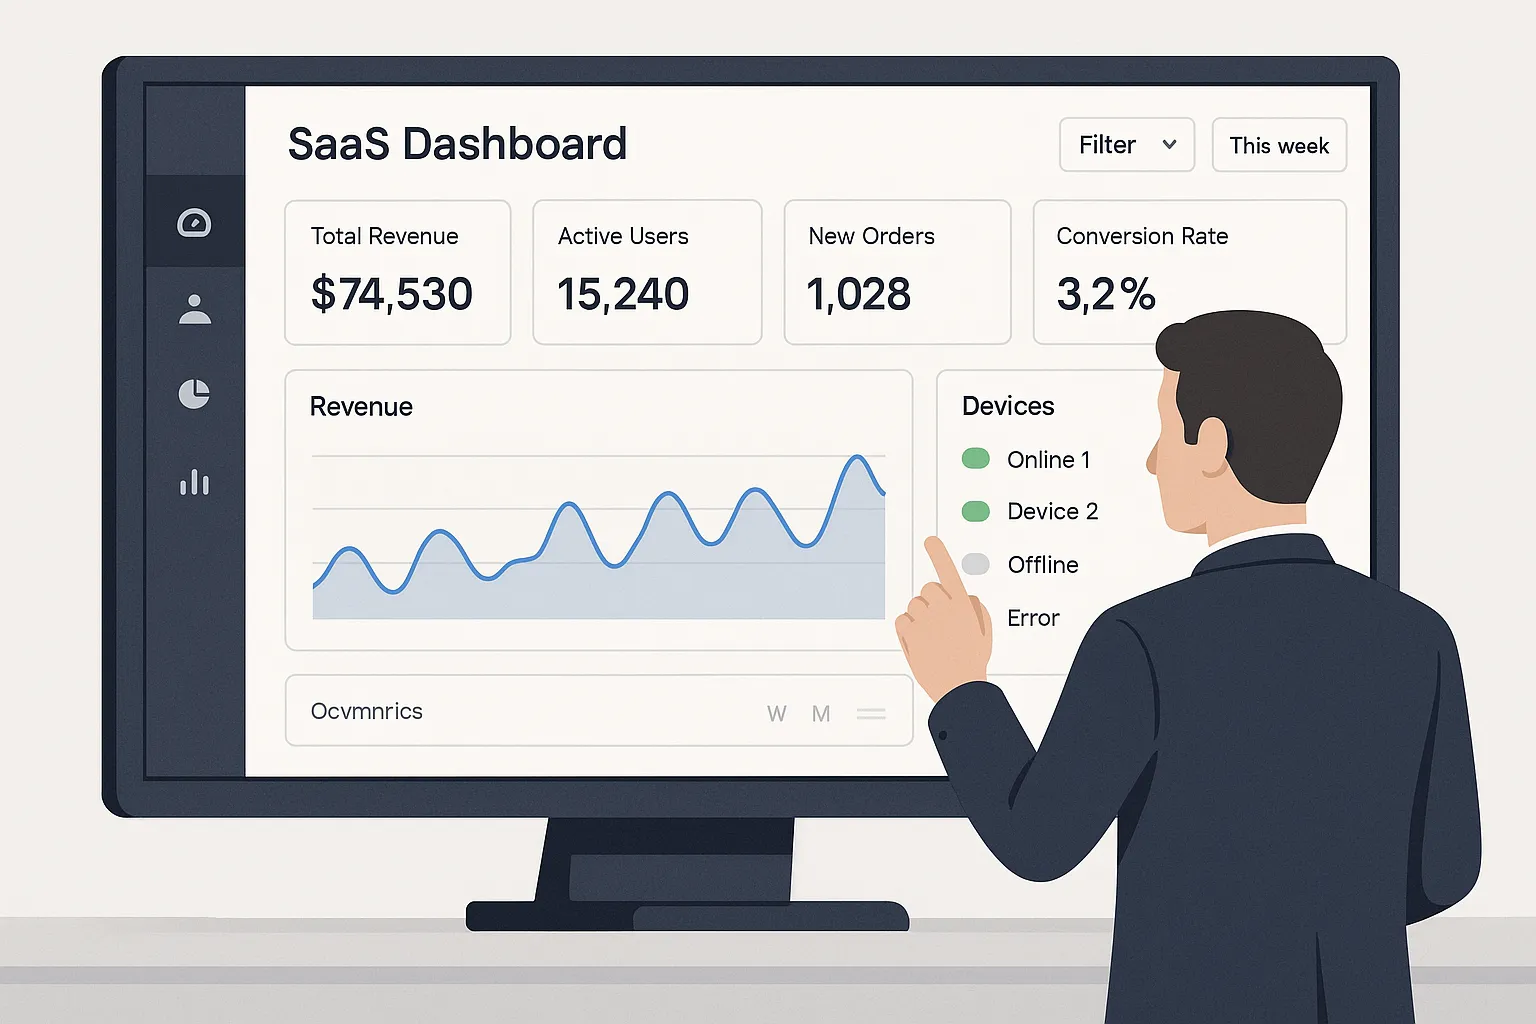
Image prompt: A polished SaaS dashboard interface illustration with metric cards, real-time line charts, device status badges, filters, and a side navigation panel on a large monitor; human operator interacting with touch-friendly components, clean minimal UI, crisp typography, realistic lighting, enterprise software aesthetic.
7. Integrating Alerting and Notification Systems
A useful IoT dashboard does more than display data; it helps users act. Alerting is what turns passive monitoring into operational response. In iot dashboard development, notifications should be designed carefully so they are timely, accurate, and not overwhelming.
Start by defining alert rules based on business impact, not just raw thresholds. For example, a slight temperature rise might be informational, but a sustained spike above a critical threshold could trigger an urgent alert. Good alerting systems support severity levels, escalation paths, and acknowledgment workflows.
Common notification channels include:
- SMS
- Slack or Teams
- Mobile push notifications
- In-app alert banners
- Webhooks for external systems
A strong alerting workflow usually includes deduplication, cooldown windows, and alert correlation. Without these, users may receive repeated alerts for the same event, which leads to fatigue and missed incidents.
You should also design acknowledgment states. Once a user sees an alert, they may need to mark it as open, in progress, resolved, or ignored. That gives the team a shared operational view and improves accountability.
A simple alert lifecycle might look like this:
| Stage | Description |
|---|---|
| Triggered | Rule condition is met |
| Delivered | Notification sent to users |
| Acknowledged | User confirms awareness |
| Resolved | Condition returns to normal |
| Logged | Event stored for auditing |
Alerting should be tightly integrated into the dashboard, not bolted on as an afterthought. Users should be able to click directly from an alert to the relevant device, chart, or incident timeline.
For more on operational workflows, see incident response for connected systems.
8. Ensuring Scalability, Performance, and Security
As your system grows, the challenge is no longer just to build iot dashboard functionality, but to keep it fast, stable, and secure at scale. Many IoT platforms start with a small device set and eventually handle thousands of sensors, multiple sites, and many concurrent users.
Performance improvements begin with smart data handling. Do not send unnecessary data to the client. Paginate large tables, compress payloads, cache frequently used metadata, and aggregate historical queries. For charts, precompute common summaries such as hourly or daily averages.
A few practical performance techniques:
- Use CDN assets for static files
- Cache device metadata and permissions
- Index time-series queries by device and timestamp
- Debounce frequent UI updates
- Load dashboard widgets progressively
Scalability also applies to the backend. Queue-based processing, horizontal service scaling, and database partitioning can reduce bottlenecks. If your device count is expected to grow quickly, plan for multi-tenant isolation and regional deployment.
Security is equally critical. An IoT dashboard often exposes sensitive operational data, so it must follow strong security practices:
- Enforce role-based access control
- Use TLS for all device and API communication
- Rotate credentials and API keys regularly
- Validate all incoming payloads
- Audit admin actions and device changes
- Protect against injection, CSRF, and broken authentication
For MQTT-based systems, secure topic naming and authentication are important. Do not expose writable topics without access controls. Separate read-only telemetry subscriptions from control commands whenever possible.
A secure, scalable system is not just safer; it is easier to maintain and more trustworthy for end users. If your product serves regulated industries, these controls may also be required for compliance.
Read more about secure design in our IoT security checklist.
9. Testing, Deployment, Monitoring, and Maintenance
Testing and deployment are the final steps that turn a prototype into a production-ready custom IoT dashboard. In practice, this is where many projects succeed or fail, because real-world device data is unpredictable.
Test across multiple layers:
- Unit tests for data transforms and UI logic
- Integration tests for broker, API, and database interactions
- End-to-end tests for user flows and alert scenarios
- Load tests for high-volume telemetry and concurrent sessions
- Security tests for auth and input validation
It is especially important to test edge cases such as offline devices, delayed messages, out-of-order timestamps, duplicate events, and malformed payloads. IoT systems deal with noisy real-world conditions, so your dashboard must be resilient.
For deployment, use a repeatable pipeline. CI/CD helps reduce human error and keeps releases predictable. A standard production workflow may include staging environments, feature flags, database migrations, and rollback plans.
After deployment, monitoring should track both infrastructure and product health. Watch for:
- API latency
- Broker message lag
- Database read/write performance
- Frontend error rates
- Alert delivery success
- User engagement with the dashboard
Maintenance is not just about fixing bugs. It also includes updating device schemas, refining alert thresholds, improving chart usability, and evolving the platform as requirements change. The best dashboards grow with the business.
For deployment patterns, see continuous delivery for real-time apps.
10. Case Studies and Real-World Examples
Looking at real-world implementations helps clarify how to design a practical custom IoT dashboard. While every project is different, most successful dashboards share a few traits: they focus on a specific operational goal, present the right data at the right time, and support quick action.
Smart manufacturing
A factory dashboard may track machine temperature, vibration, uptime, and maintenance alerts. Real-time charts help operators catch anomalies before equipment fails. In this case, real time iot data visualization is essential because small changes can signal larger problems.
Smart buildings
A facilities dashboard might monitor HVAC performance, room occupancy, energy usage, and air quality. Users often need both live and historical views to optimize comfort and reduce costs.
Fleet and logistics
Fleet dashboards commonly show vehicle location, fuel levels, engine health, and route exceptions. Alerts may notify operators when a vehicle deviates from route or requires service.
Agriculture
In agriculture, dashboards may track soil moisture, weather data, irrigation status, and greenhouse conditions. Clear threshold alerts help teams react quickly to environmental changes.
These examples show that a dashboard succeeds when it is built around a decision-making workflow. The best designs do not overwhelm users with raw telemetry. Instead, they surface context, prioritize important changes, and support drill-down analysis.
If you are planning your own platform, a phased approach works well:
- Define one primary use case.
- Choose a lightweight, maintainable stack.
- Build ingestion and storage first.
- Add real-time visuals and alerts.
- Harden security, testing, and monitoring.
This approach keeps the project manageable and makes it easier to expand later. A thoughtful mqtt dashboard design can support a single factory, a multi-site deployment, or a customer-facing SaaS product as long as the foundation is solid.
For related strategy content, explore digital transformation with connected devices.
Looking for an IoT app development partner?
Are you looking for a reliable partner to help you build a stunning IoT companion app? You're in the right place.
We have 6+ years of experience building a variety of IoT apps, from healthcare to HVAC. So, if you go with us, you'll be in safe hands.
If you want to learn more, feel free to reach out and our team will be happy to set up a call to discuss your needs in more detail.
Get in touch

